
WhichStat for Excel
Which statistic fits your data?
A guided descriptive statistics add-in for Microsoft Excel. Select a column; WhichStat fingerprints the sample, ranks which summary should be reported, proves the recommendation with plots and writes a watermark-free PDF. Always free, no account, and the numbers never leave Excel.
Data fingerprint
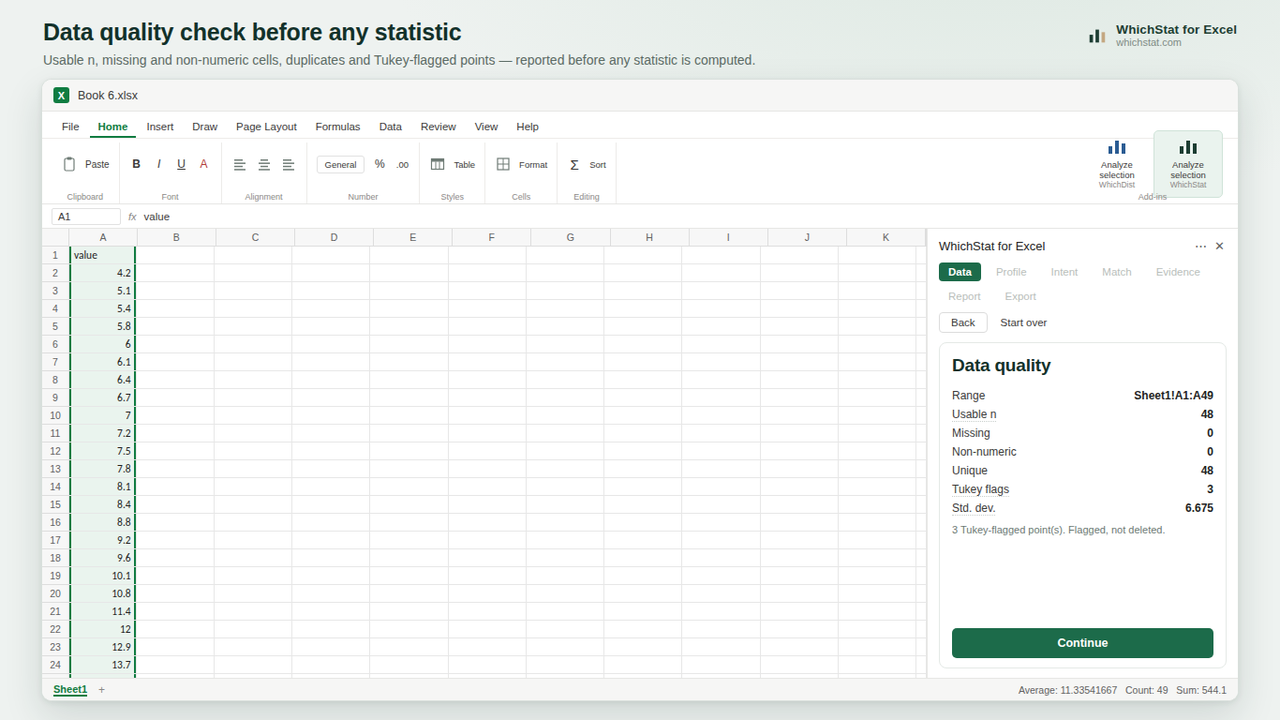
Type, usable n, missing cells, skew, excess kurtosis and Tukey flags are extracted before any recommendation.
Ranked summary
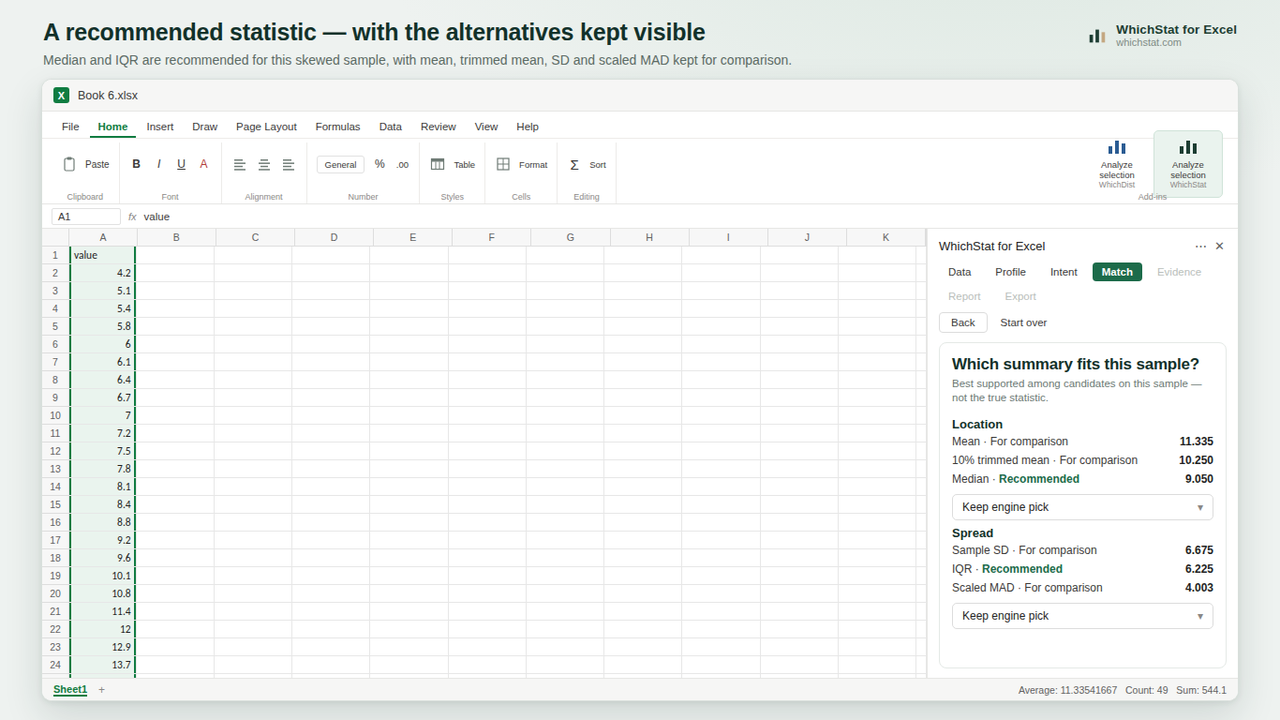
A documented rule ranks the location and spread candidates; mean and standard deviation stay visible for comparison.
Evidence plots
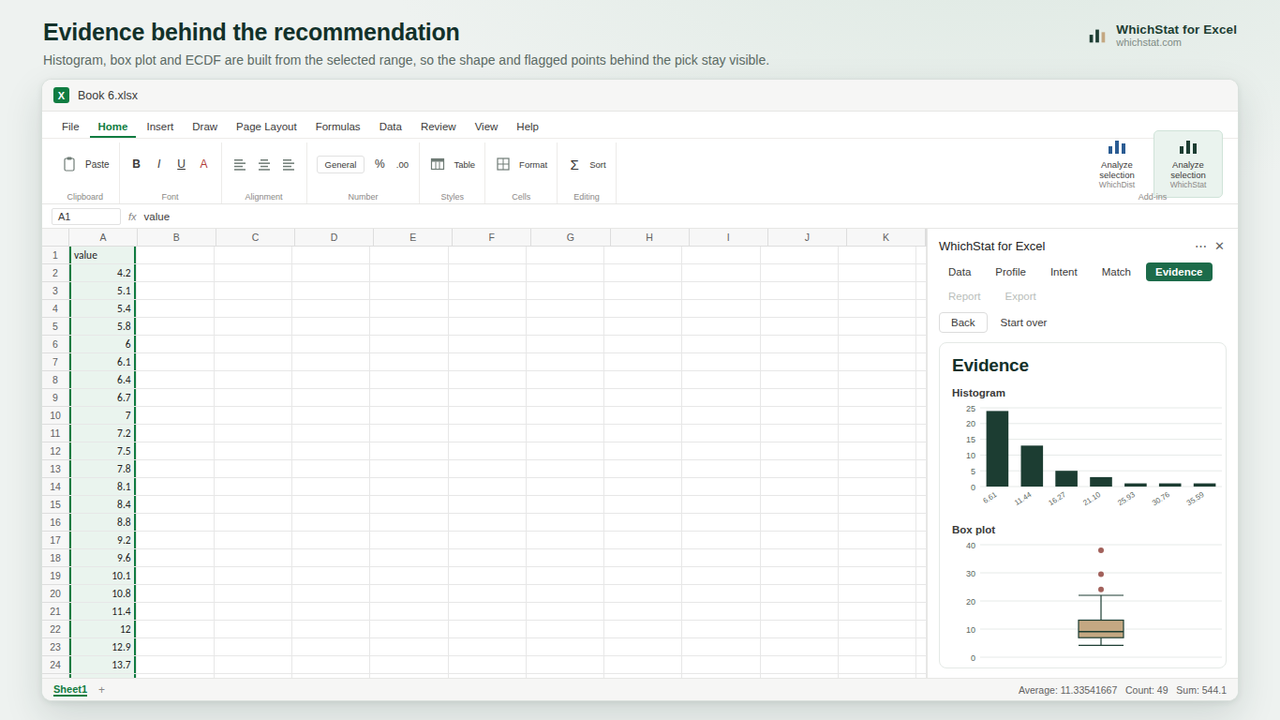
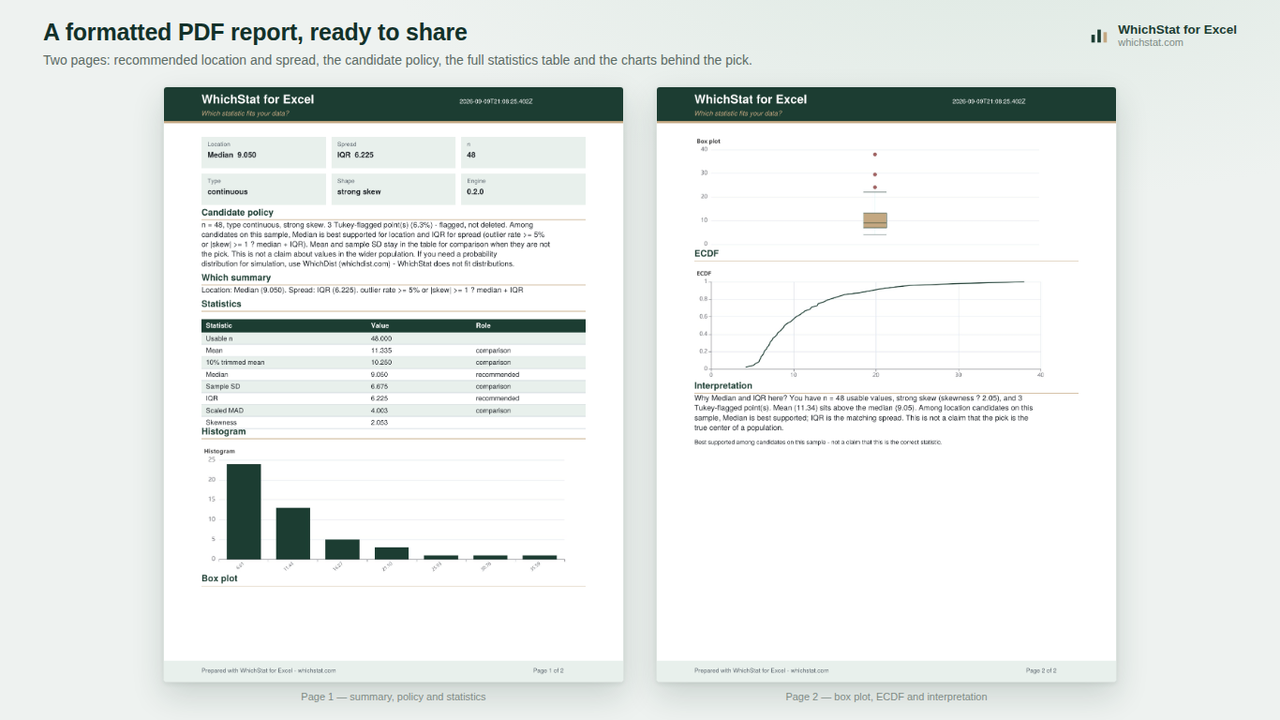
Histogram, box plot and ECDF; the same charts are embedded in the PDF report.
Watermark-free PDF report
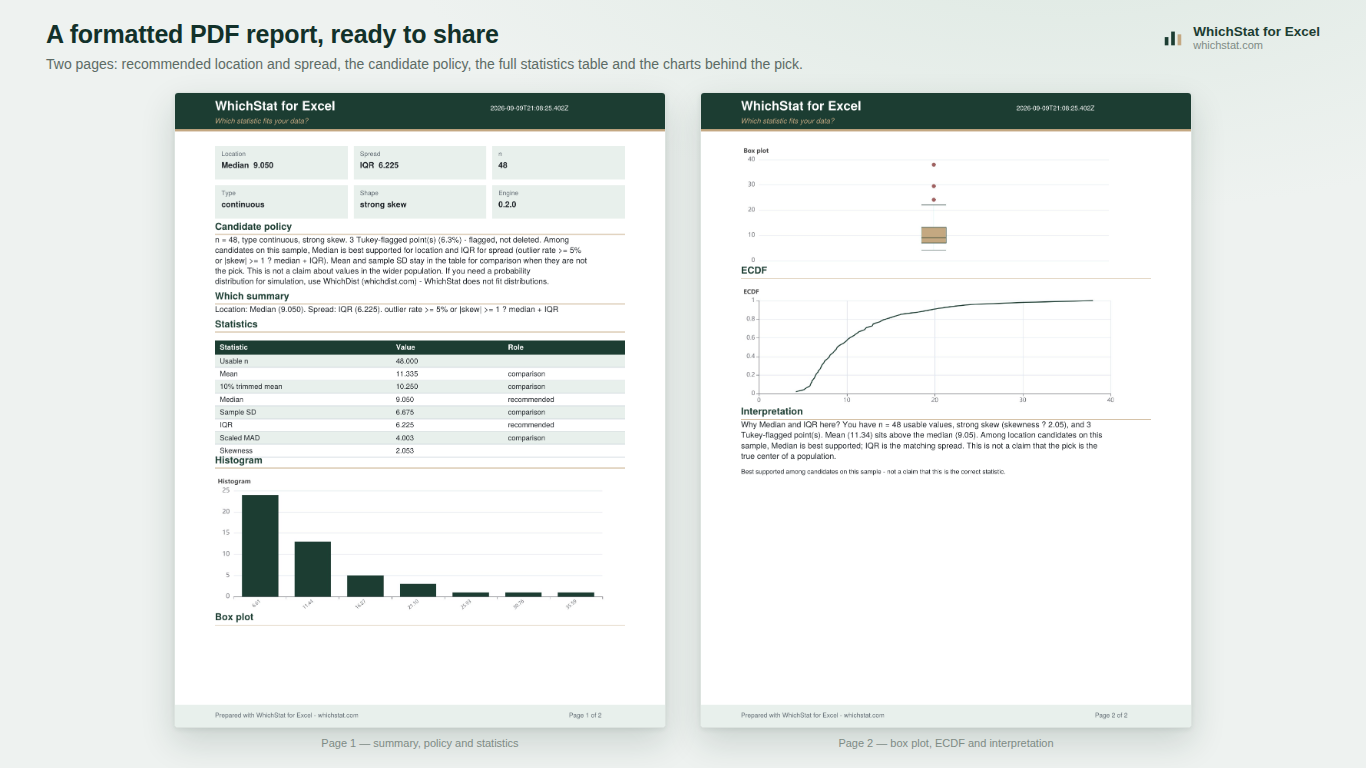
The report is generated entirely client-side; the optional footer can be turned off.
Results inside Excel
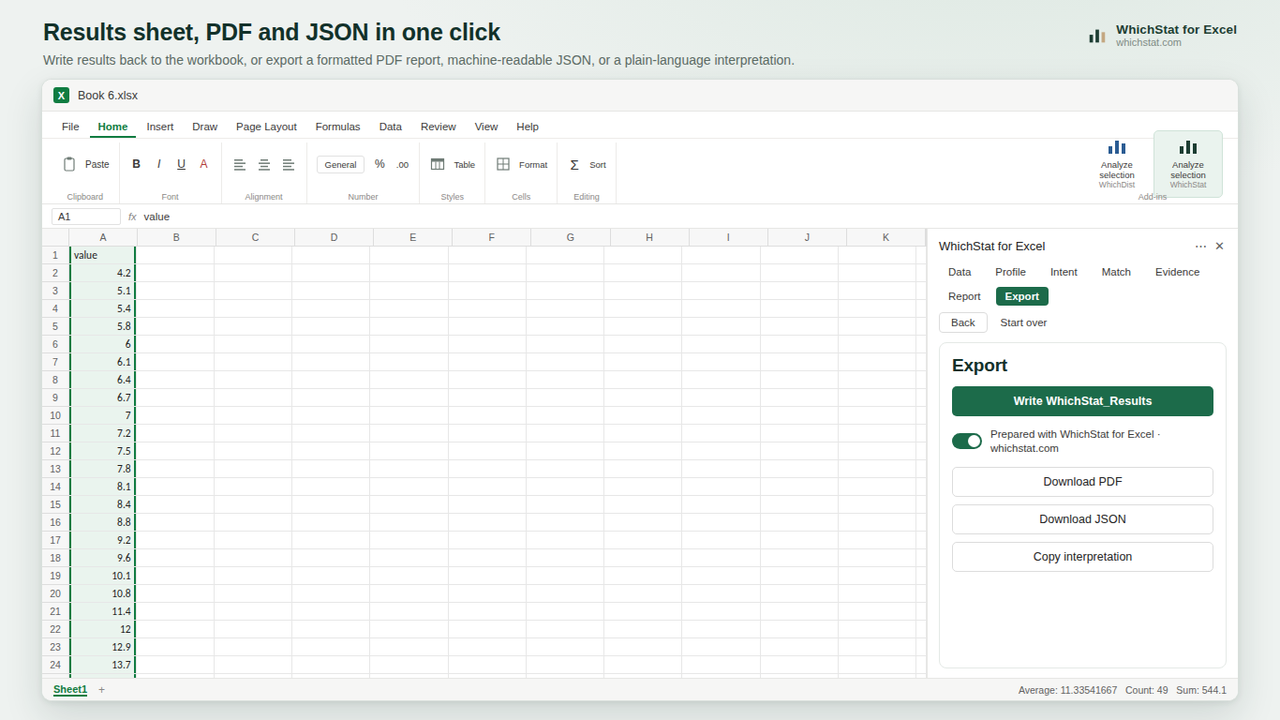
Results are written to a WhichStat_Results sheet as named tables; PDF and JSON export are supported.
Offline and private
The analysis runs entirely inside Excel; raw sample data is never uploaded and no account is needed.
Descriptive statistics, done where the data already lives. Select a numeric range; WhichStat profiles the sample first, then ranks which location and spread measure should be reported for that sample and shows the reasoning with plots.
Why WhichStat?
Fingerprint first: Type, usable n, missing and non-numeric cells, skew, excess kurtosis and Tukey flags are extracted before any recommendation is made. Outliers are flagged, not deleted.
Ranked summary: A documented rule ranks the location and spread candidates for the sample. Mean and standard deviation stay visible for comparison even when they are not the pick.
Evidence plots: Histogram, box plot (grouped when comparing) and ECDF; the same charts are embedded in the PDF report.
Watermark-free PDF: The report is generated entirely client-side; the optional footer can be turned off.
Inside Excel: Results are written to a WhichStat_Results sheet as named tables; PDF export and a JSON export that strips the raw vector are supported.
Summaries considered
Mode, proportion, median, mean, 10% trimmed mean, sample standard deviation, interquartile range (IQR) and scaled MAD. For every recommendation, when to use it, when to avoid it and the assumptions behind it are explained in short cards.
Privacy
The analysis runs entirely inside Excel. Raw sample data is never uploaded and the JSON export contains no raw vector. Installation is done from Insert → Add-ins in Microsoft 365 Excel on Windows, Mac and the web.
 Enlarge
 Enlarge
 Enlarge
 Enlarge
 Enlarge
 Enlarge